
One of the main talking points pushed by climate alarmists over the years has been that the Arctic summer sea ice is declining.
This line has been used to strike fear into the public by constantly warning that we’ll all be doomed once it soon disappears.
However, evidence has now emerged to reveal that Arctic summer sea ice stopped declining a decade ago but climate scientists have covered it up.
Nevertheless, green activists have spared no effort to continue promoting the poster scare that humans will cause it all to disappear within a few years.
In his recent BBC Frozen Planet II agitprop, Sir David Attenborough claimed Arctic summer sea ice might all be gone by 2035.
In an excellent piece of investigative reporting titled Lies, Damned Lies and Arctic Graphs, the climate writer Tony Heller recently lifted the lid on many of the tactics used to keep the scare in the headlines.
“They bury all the older data and pretend they don’t notice sea ice is increasing again,” he charges.
“What they are doing is not science but propaganda.”
The Daily Sceptic has written a number of articles of late noting that summer sea ice extent in the Arctic is recovering.
In Greenland, the outlet reported that the ice sheet may have increased in the year to August 2022.
Invariably, social media commentators reply by publishing the sea ice graph below, compiled by the U.S. National Snow and Ice Data Center (NSIDC).
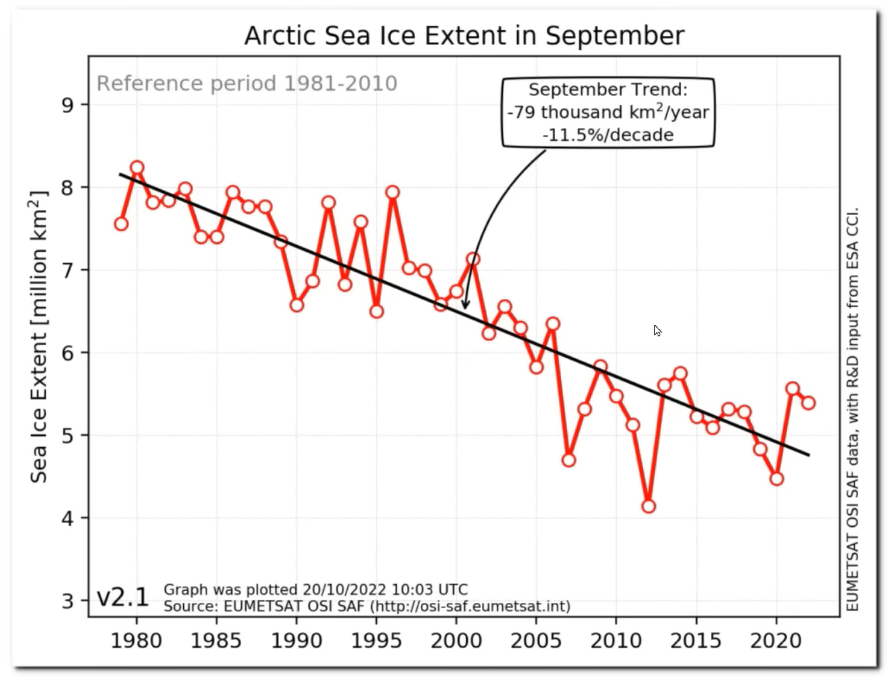
This is reproduced from Heller’s YouTube work and shows a linear decrease in September (the lowest point of annual sea ice) from 1979.
There is something wrong with this graph, notes Heller, since the minimum is actually higher now than 10 and 15 years ago.
However, the crude straight black “trend” line tricks the eye into missing this.
He plots the data as a moving average to show the real trend more clearly.
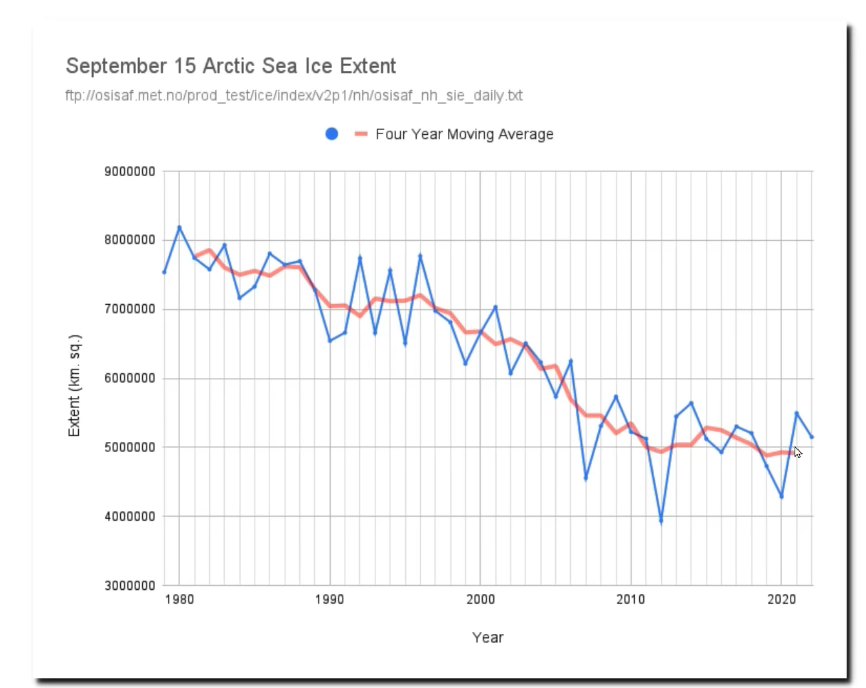
We see here the end of the decline in summer sea ice started a decade ago.
The low point on which most fanciful forecasts of a North Pole passage are based is 2012.
Heller notes that sea ice changes are cyclical, not linear. And he is right.
Drawing a straight line down from a 1979 high point to a lower point tells us nothing about current trends.
Heller then goes on to ask why the graphs start at 1979.
The NSIDC and NASA say it is because satellite records started in 1979.
Heller says this is a good story “except for the fact that it isn’t true.”
He goes on to quote the first UN Intergovernmental Panel on Climate Change (IPCC) report in 1990 that stated: “Satellite observations have been used to map sea ice extent routinely since the early 1970s.
“The American Navy Joint Ice Center has produced weekly charts which have been digitized by NOAA [the U.S. weather service].”
It might not be a surprise to learn that sea ice extent was lower in the 1970s and it peaked in 1979.
By starting the graph in 1979 a “fake” linear downward trend is produced.
What they are doing, is hiding crucial data, Heller says.
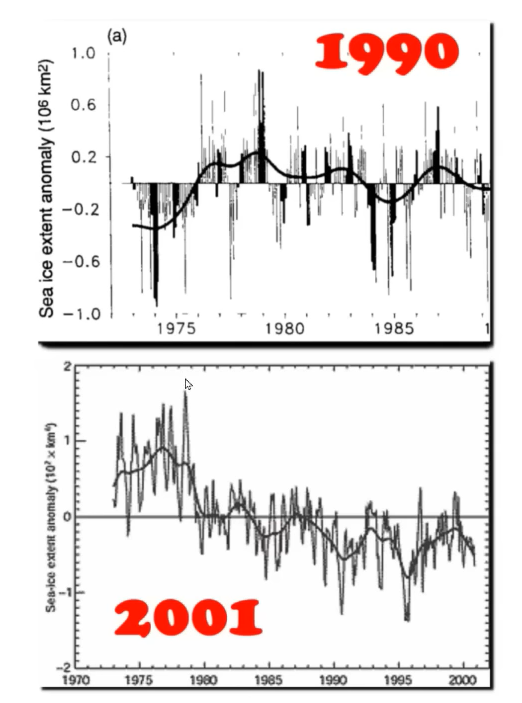
This “hidden” data is clearly shown above in a graph from the first IPCC report in 1990.
The lower levels of ice in the 1970s are plotted and the peak is in 1979.
But by 2001, the IPCC had removed much of the increase of that decade, and now the chart shows the ice actually starting to fall from 1975.
Heller also provides evidence that the 1950s, which are not shown on these charts, had lower sea ice than the 1970s, meaning the 1970s were a recent peak.
He goes on to note that the 2001 IPCC report also saw the publication of the “hockey stick” temperature graph that became notorious for removing the medieval warm period.
Sea ice in the Arctic, like most if not all climate trends, is cyclical, not linear.
Heller notes the influence of the Atlantic Multi-decadal Oscillation, a cyclical ocean current whose warming and cooling seem to be influential in controlling Arctic temperatures.
Records and observations going back to the early 1800s show considerable variations in the ice extent.
Attenborough is not alone in forecasting boating at the North Pole.
It’s been a cut-and-paste scare story for decades.
Heller notes a comment in the New York Times from 1958 that read: “Some scientists estimate that the polar ice pack is 40% thinner and 12% less in area than it was a half-century ago, and that even within the lifetime of our children, the Arctic ocean may open, enabling ships to sail over the North Pole.”
Meanwhile, the latest updates on the Arctic sea ice and the Greenland ice sheet show a continuing improving trend towards higher extents.
November sea ice was 1.05 million square kilometers greater than a record low in 2016 of 8.66m sq km.
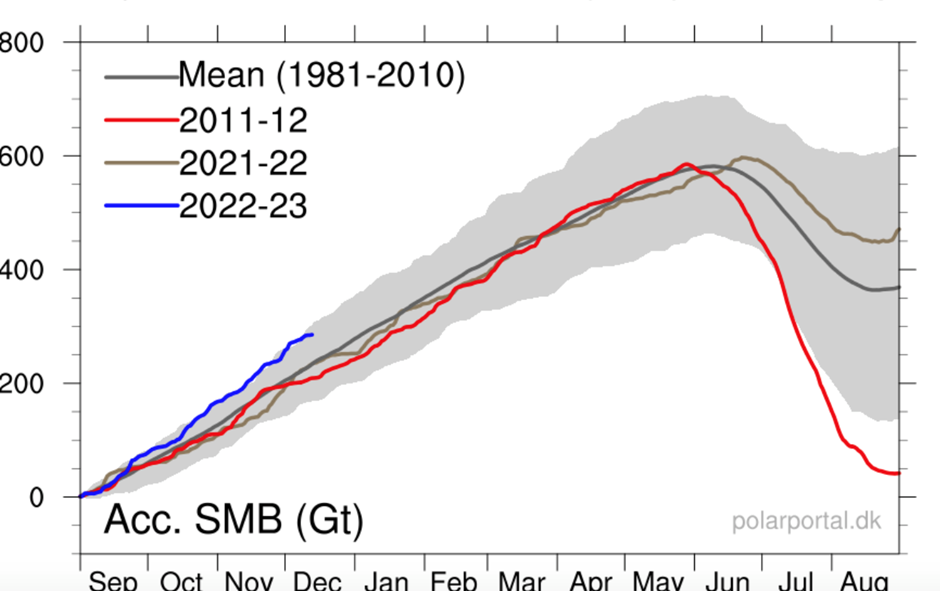
The surface mass of the Greenland ice sheet (above), measured by the Danish Meteorological Institute, has shown some stonking improvements over the last two months, with the 2022-23 blue line ahead of all the previous marks shown.
Tony Heller’s investigative work is important in calling out the “settled” climate science cartel that runs a postmodern, pseudoscience campaign designed to implement a politically-contrived Net Zero agenda.
Perhaps the corporate media and their so-called “fact-checkers” should start investigating some of the biased data that bombards the carefully-curated public discourse – starting with climate model forecasts that are never correct, attribution studies that invent stories about humans causing bad weather, and corrupted surface temperature databases that continually adjust their “record” figures higher.
READ MORE: George Soros Pushes Plan to Fight ‘Climate Change’ by Blocking the Sun

Our comment section is restricted to members of the Slay News community only.
To join, create a free account HERE.
If you are already a member, log in HERE.